19 Powder OAI Tutorial
This tutorial will walk you through the process of creating a small LTE network on Powder using OAI. Your copy of OAI will run on bare-metal machines that are dedicated for your use for the duration of your experiment. You will have complete administrative access to these machines, meaning that you have full ability to customize and/or configure your installation of OAI. OAI can simulate a UE and RAN, but in this tutorial, we will focus on using an off the shelf Nexus 5 phone as a UE communicating with an eNodeB with a B210 USRP SDR as the base station.
19.1 Objectives
In the process of taking this tutorial, you will learn to:
Log in to Powder
Create your own LTE network by using a pre-defined profile
Access resources in the network that you create
Create an end-to-end connection from the UE, through the RAN, across an EPC, and out to the commodity Internet.
Clean up your experiment when finished
Learn where to get more information
19.2 Prerequisites
This tutorial assumes that you have an existing account on Powder (Instructions for getting an account can be found here.)
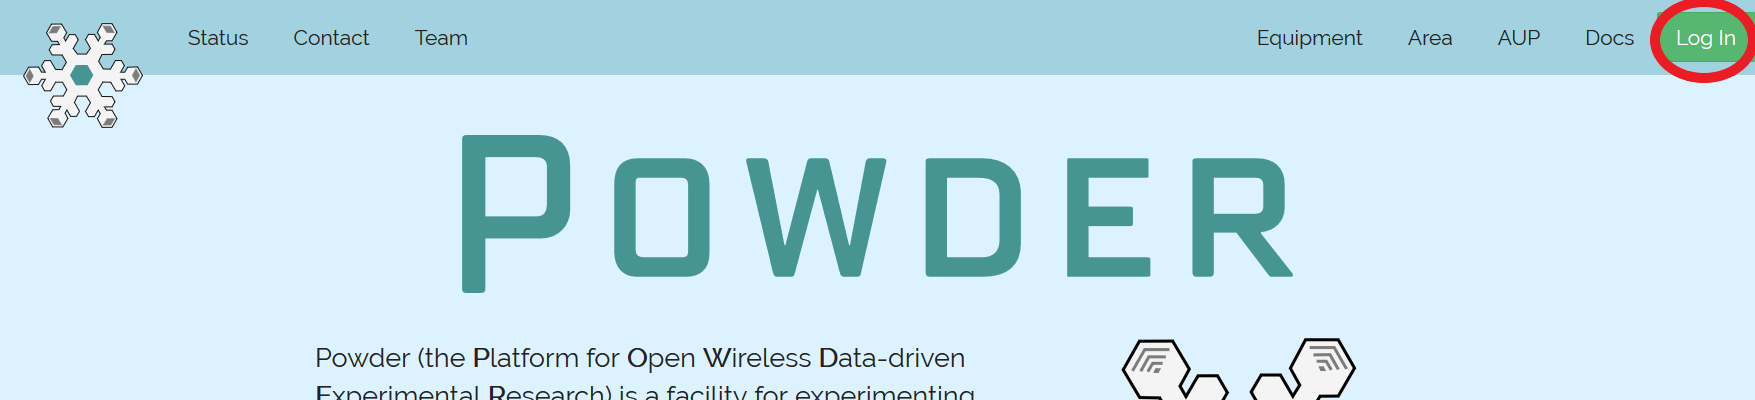
19.3 Logging In
The first step is to log in to Powder; Powder is available to
researchers and educators who work in radio networking and have accepted the Powder AUP.
If you have
an account at one of its federated facilities, like
Emulab or
CloudLab, then you already have an account at
Powder.
19.4 Building Your Own OAI Network
Once you have logged in to Powder, you will “instantiate” a “profile” to create an experiment. Profiles are Powder’s way of packaging up configurations and experiments so that they can be shared with others. Each experiment is separate: the experiment that you create for this tutorial will be an instance of a profile provided by the facility, but running on resources that are dedicated to you, which you have complete control over. This profile uses local disk space on the nodes, so anything you store there will be lost when the experiment terminates.
The OAI network we will build in this tutorial is very small, but Powder will have city-scale infrastructure that can be used for larger-scale experiments.
For this tutorial, we will use a basic profile that brings up a small LTE network. The Powder staff have built this profile by capturing disk images of a partially-completed OAI installation and scripting the remainder of the install (customizing it for the specific machines that will get allocated, the user that created it, the SIM card in the allocated phone, etc.) See this manual’s section on profiles for more information about how they work.
- Start Experiment
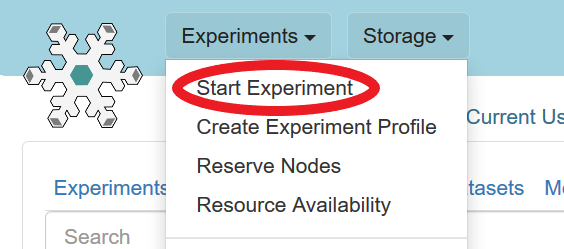 After logging in, you are taken to your main status dashboard. Select “Start Experiment” from the “Experiments” menu.
 - Select a profile
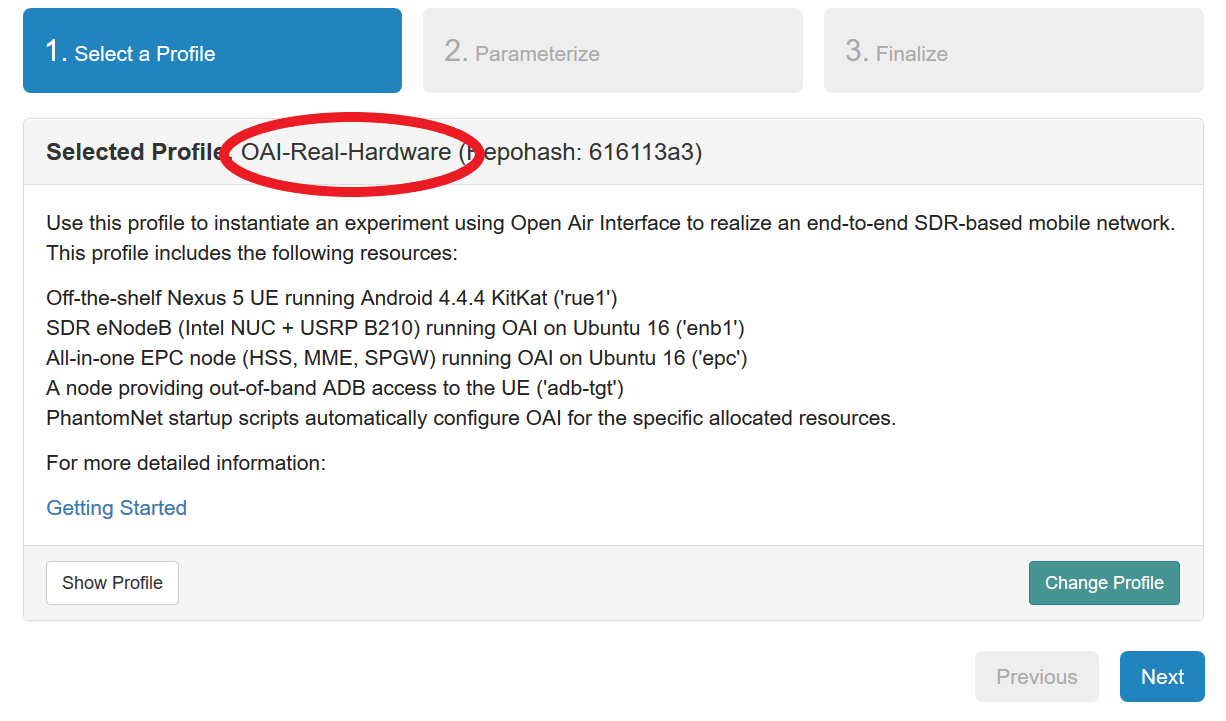 The “Start an Experiment” page is where you will select a profile to instantiate. We will use the OAI-Real-Hardware profile; if it is not selected, follow this link or click the “Change Profile” button, and select “OAI-Real-Hardware” from the list on the left.Once you have the correct profile selected, click “Next”
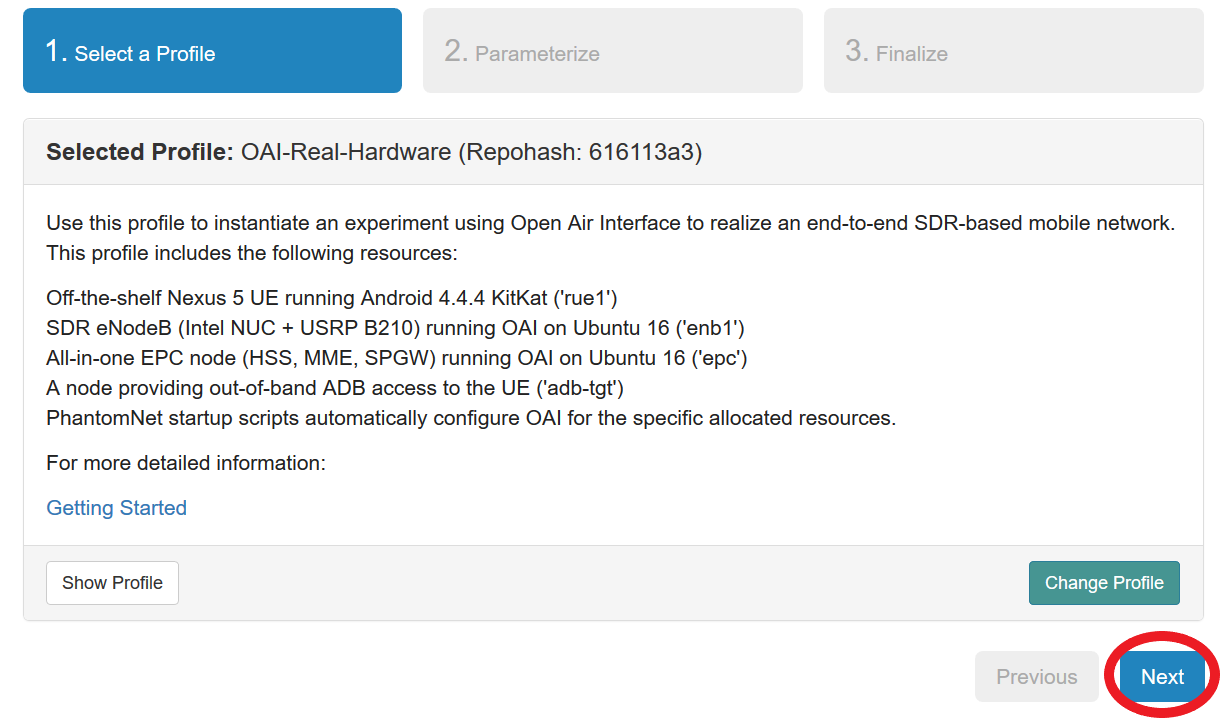
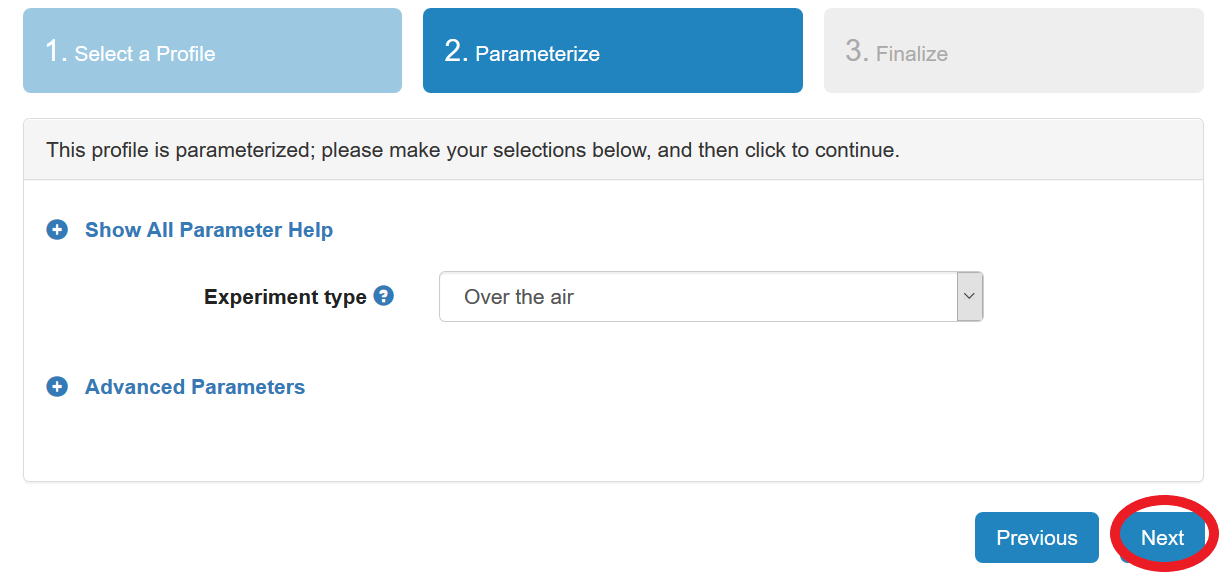
- Set parametersProfiles in CloudLab can have parameters that affect how they are configured; for example, this profile has parameters that allow you to specify whether the experiment will use real hardware over-the-air, across an attenuator, or with a simulated RAN.For this tutorial, we will leave all parameters at their defaults and just click “next”.
- Click Finish!When you click the “finish” button, Powder will start provisioning the resources that you requested.
You may optionally give your experiment a name—
this can be useful if you have many experiments running at once. 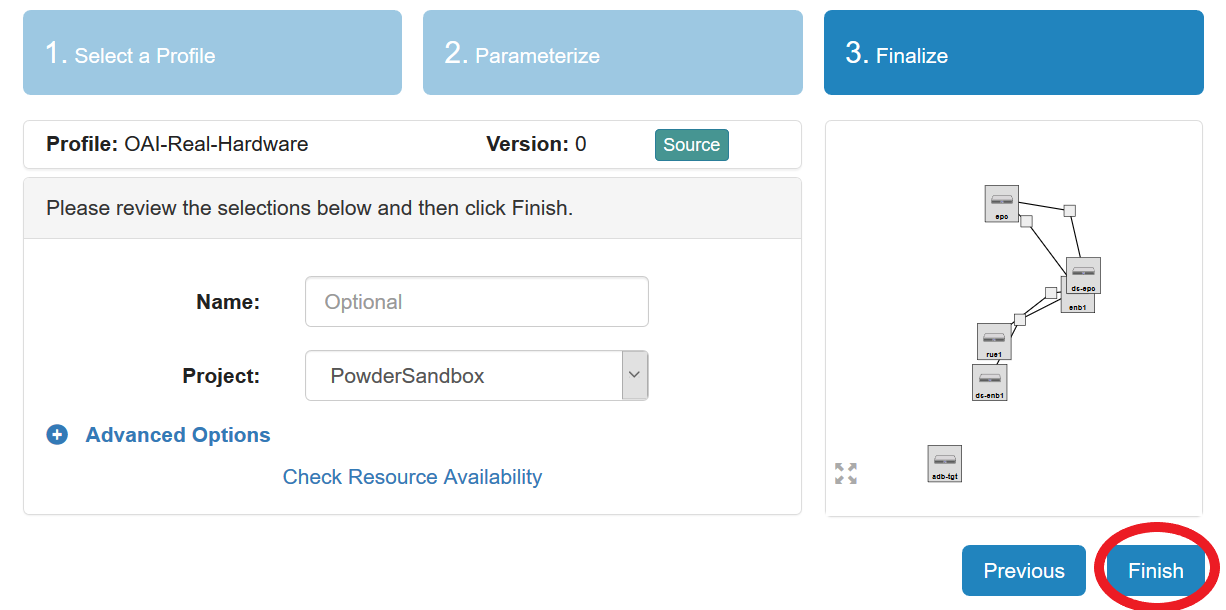
- Powder instantiates your profilePowder will take a few minutes to bring up your copy of OAI, as many things happen at this stage, including selecting suitable hardware, loading disk images on local storage, booting bare-metal machines, re-configuring the network topology, etc. While this is happening, you will see this status page:
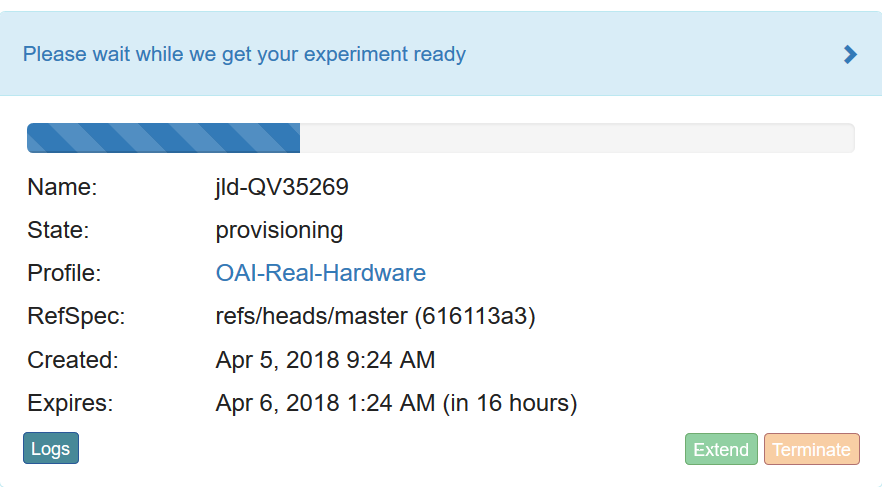
Provisioning is done using the GENI APIs; it is possible for advanced users to bypass the Powder portal and call these provisioning APIs from their own code. A good way to do this is to use the geni-lib library for Python.
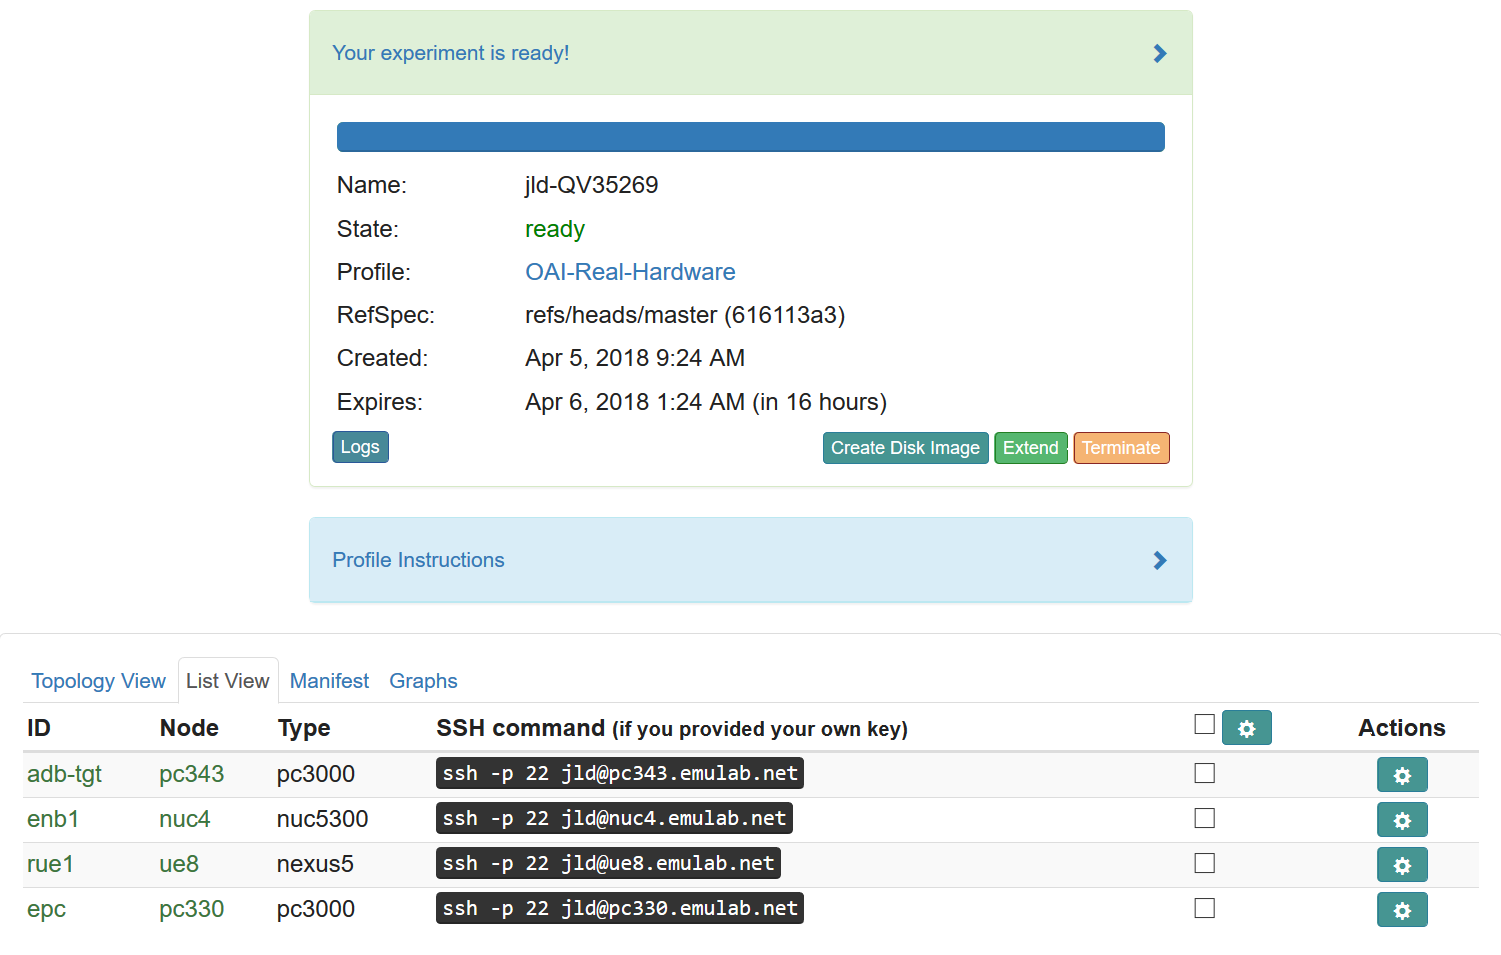
As soon as a set of resources have been assigned to you, you will see details about them at the bottom of the page (though you will not be able to log in until they have gone through the process of imaging and booting.) While you are waiting for your resources to become available, you may want to have a look at the Powder user manual, or use the “Sliver” button to watch the logs of the resources (“slivers”) being provisioned and booting. - Your network is ready!When the web interface reports the state as “Booted”, your network is provisioned, and you can proceed to the next section.
19.5 Exploring Your Experiment
Now that your experiment is ready, take a few minutes to look at various parts of the Powder status page to help you understand what resources you’ve got and what you can do with them.
19.5.1 Experiment Status
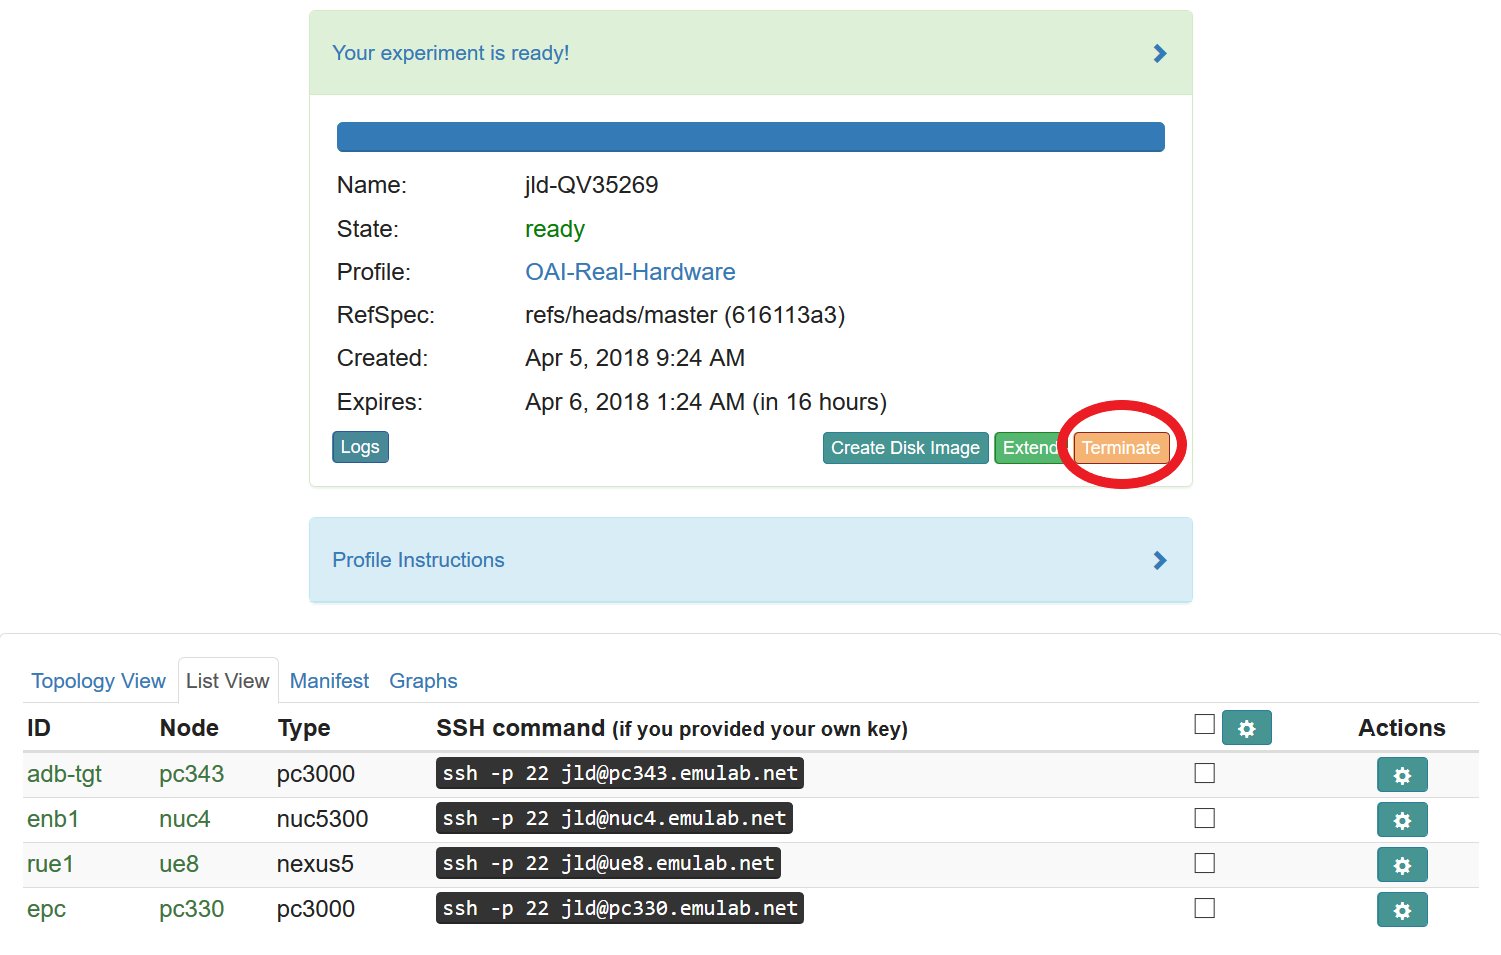
The panel at the top of the page shows the status of your experiment—
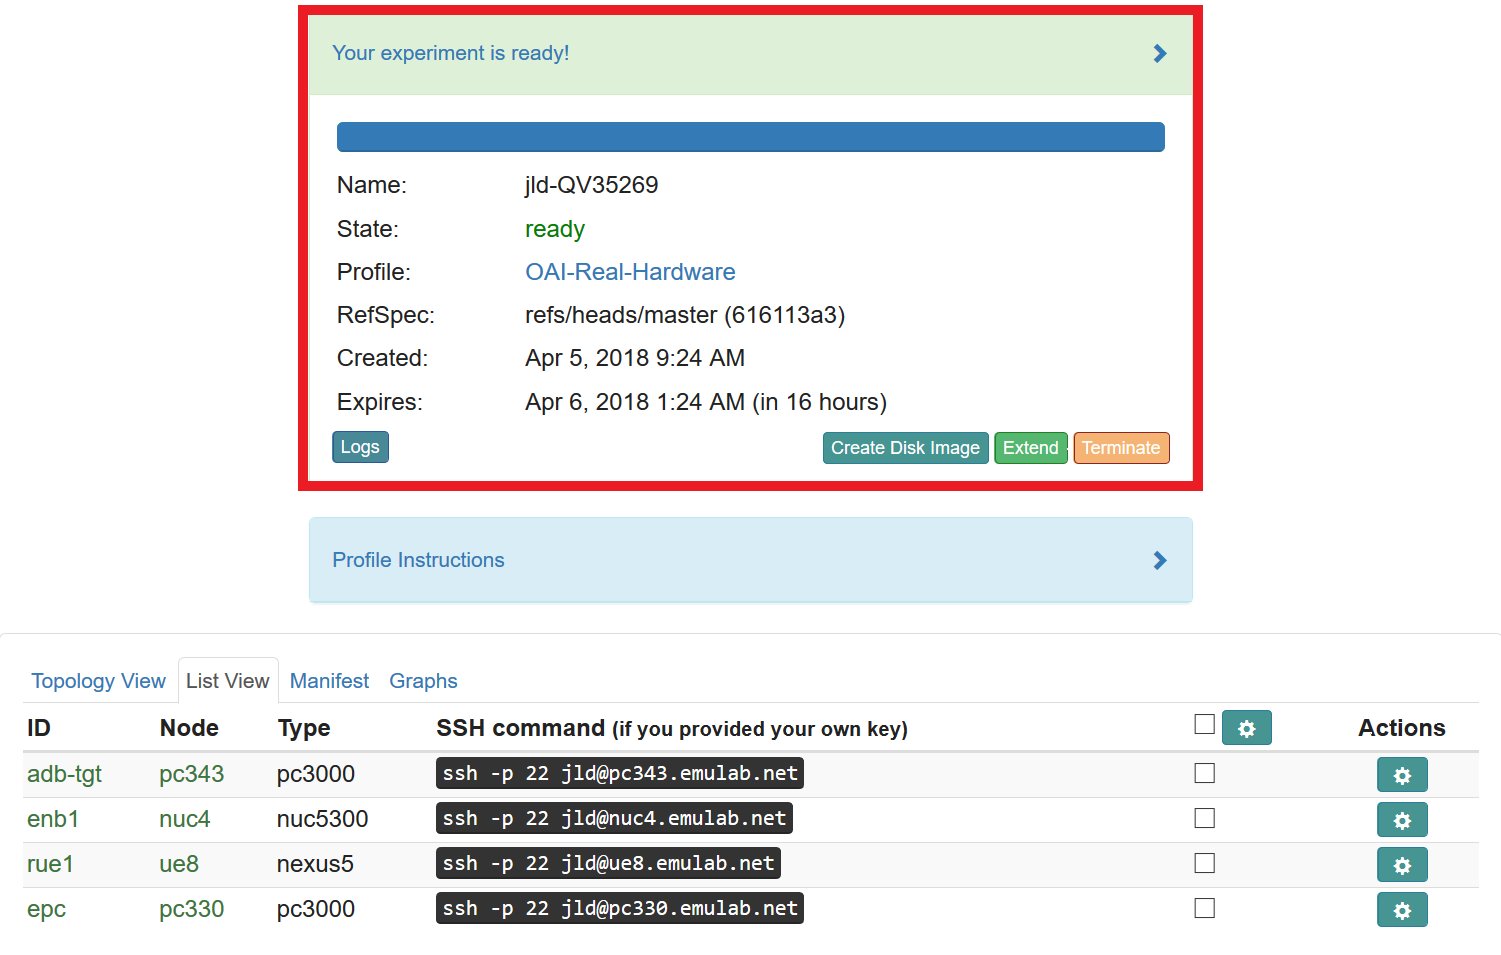
Note that the default lifetime for experiments on Powder is less than a day; after this time, the resources will be reclaimed and their disk contents will be lost. If you need to use them for longer, you can use the “Extend” button and provide a description of why they are needed. Longer extensions require higher levels of approval from Powder staff. You might also consider creating a profile of your own if you might need to run a customized environment multiple times or want to share it with others.
You can click the title of the panel to expand or collapse it.
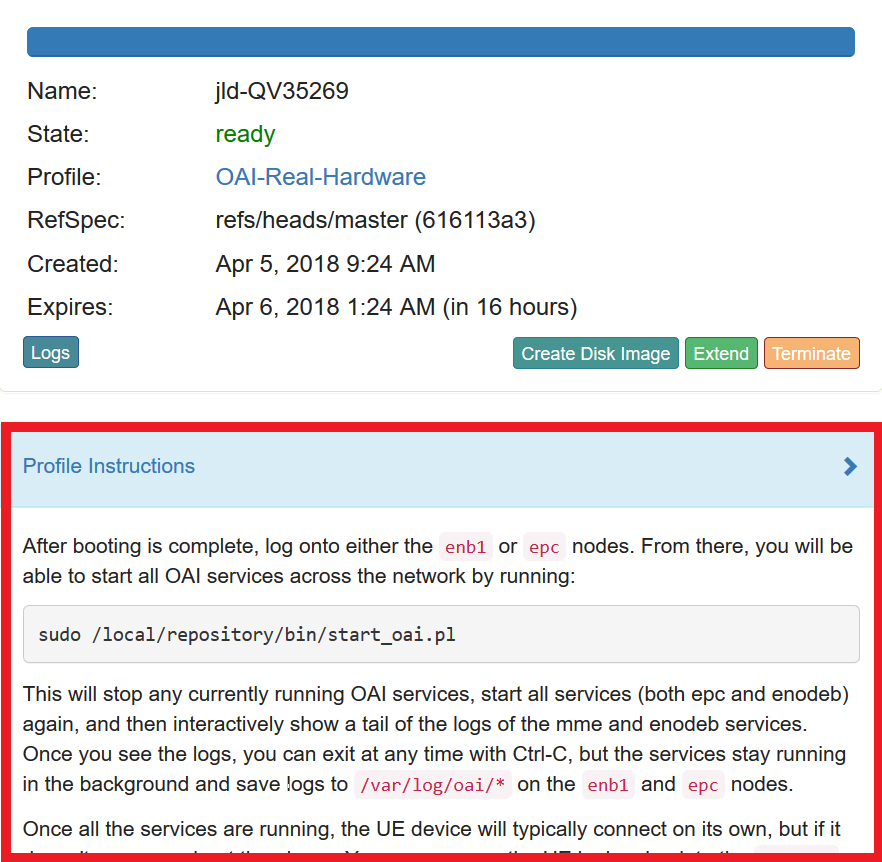
19.5.2 Profile Instructions
Profiles may contain written instructions for their use. Clicking on the title of the “Profile Instructions” panel will expand (or collapse) it; in this case, the instructions provide details on how to start running OAI services and a link to further documentation on how this profile works and how to work with it.
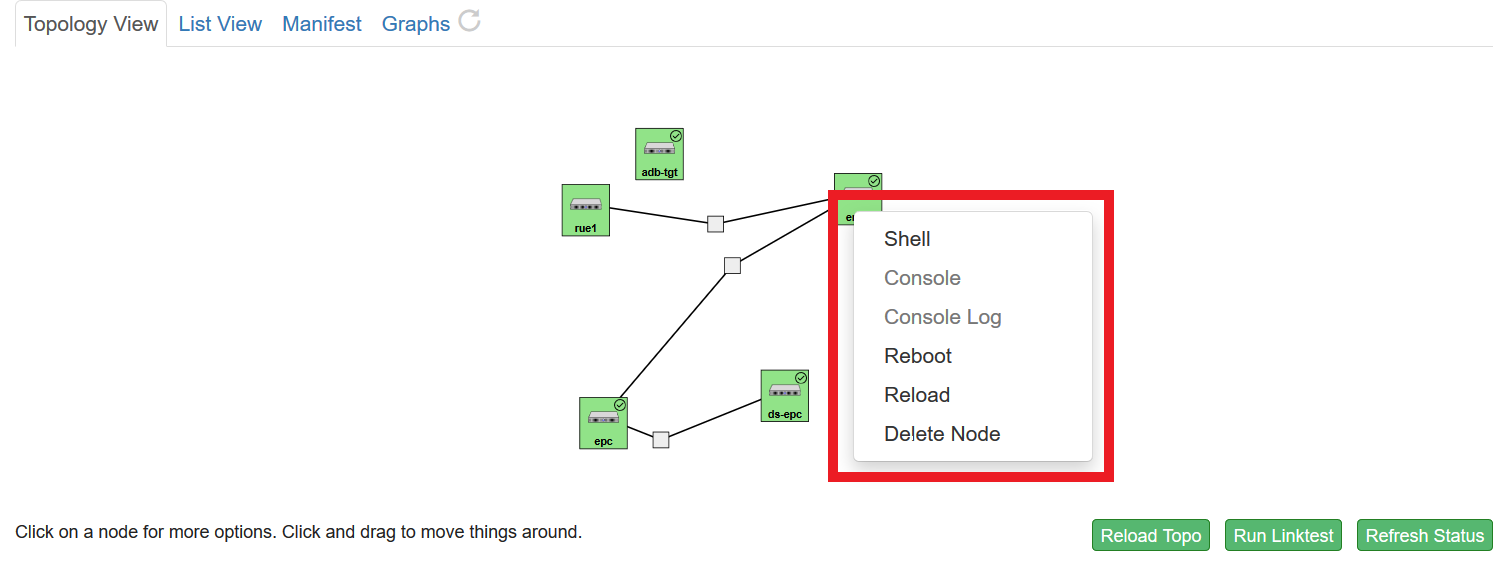
19.5.3 Topology View
At the bottom of the page, you can see the topology of your experiment. This profile has separate nodes for the OAI EPC and eNodeB. In addition, it has a VM (“adb-tgt”) that lets you control the Nexus 5 UE. The names given for each node are the names assigned as part of the profile; this way, every time you instantiate a profile, you can refer to the nodes using the same names, regardless of which physical hardware was assigned to them. The green boxes around each node indicate that they are up; click the “Refresh Status” button to initiate a fresh check.
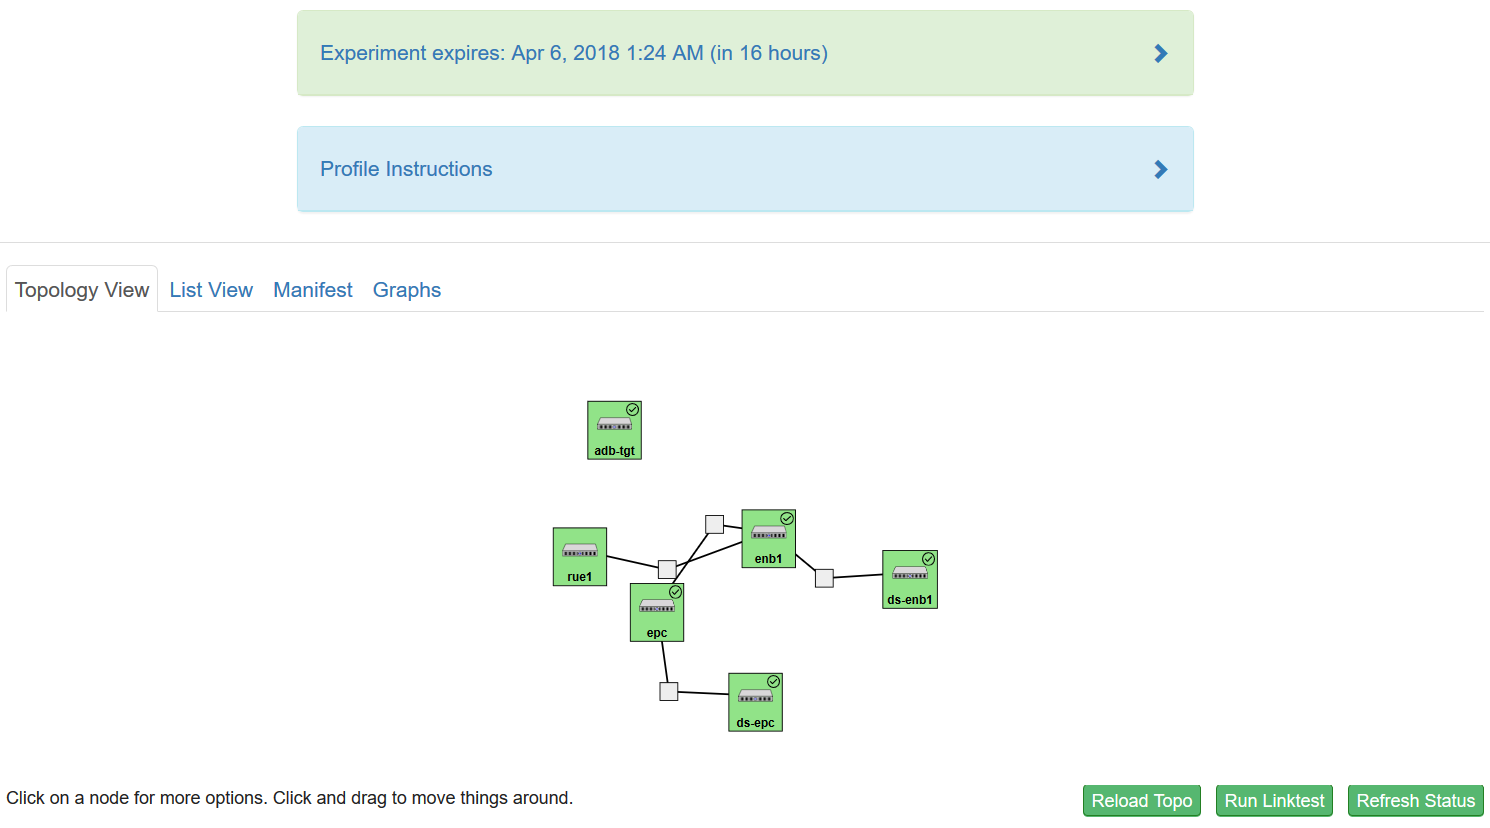
If an experiment has “startup services” (programs that run at the beginning of the experiment to set it up), their status is indicated by a small icon in the upper right corner of the node. You can mouse over this icon to see a description of the current status.
It is important to note that most nodes in Powder have at least two network interfaces: one “control network” that carries public IP connectivity, and one “experiment network” that is isolated from the Internet and all other experiments. It is the experiment net that is shown in this topology view. You will use the control network to ssh into your nodes and interact with them. This separation gives you more freedom and control in the private experiment network, and sets up a clean environment for repeatable research.
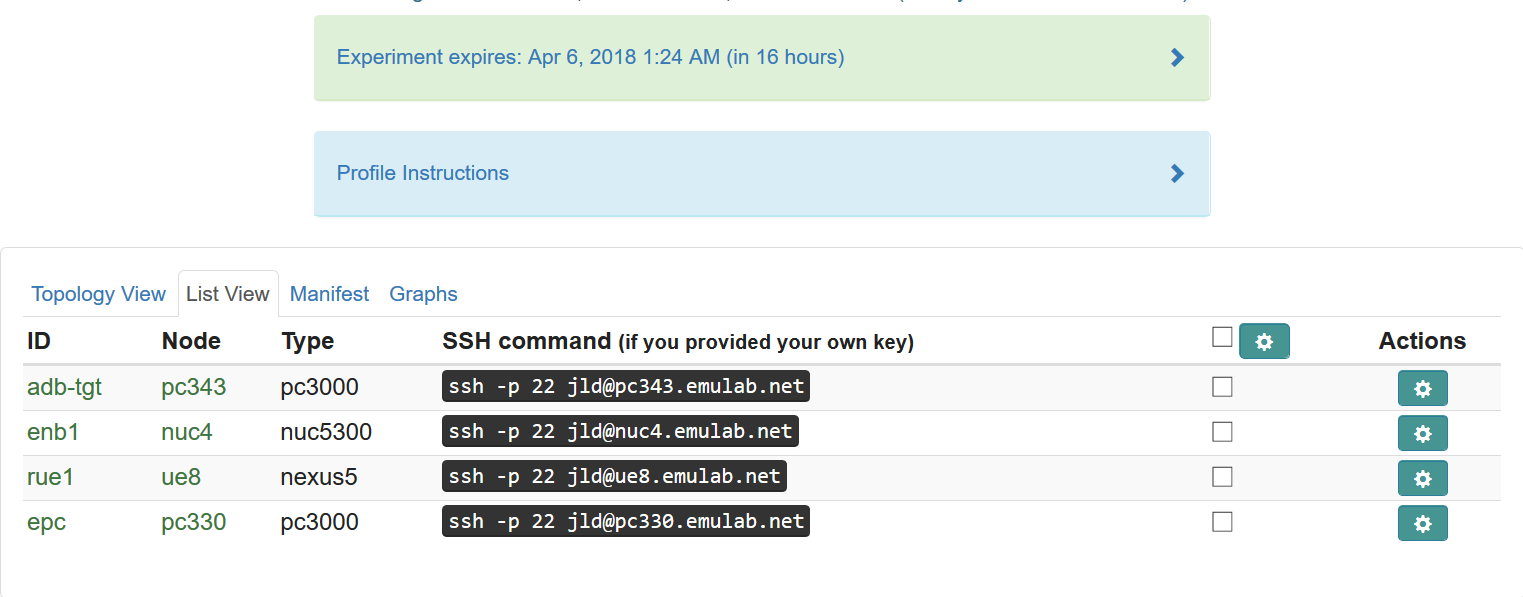
19.5.4 List View
The list view tab shows similar information to the topology view, but in a different format. It shows the identities of the nodes you have been assigned, and the full ssh command lines to connect to them. In some browsers (those that support the ssh:// URL scheme), you can click on the SSH commands to automatically open a new session. On others, you may need to cut and paste this command into a terminal window. Note that only public-key authentication is supported, and you must have set up an ssh keypair on your account before starting the experiment in order for authentication to work.
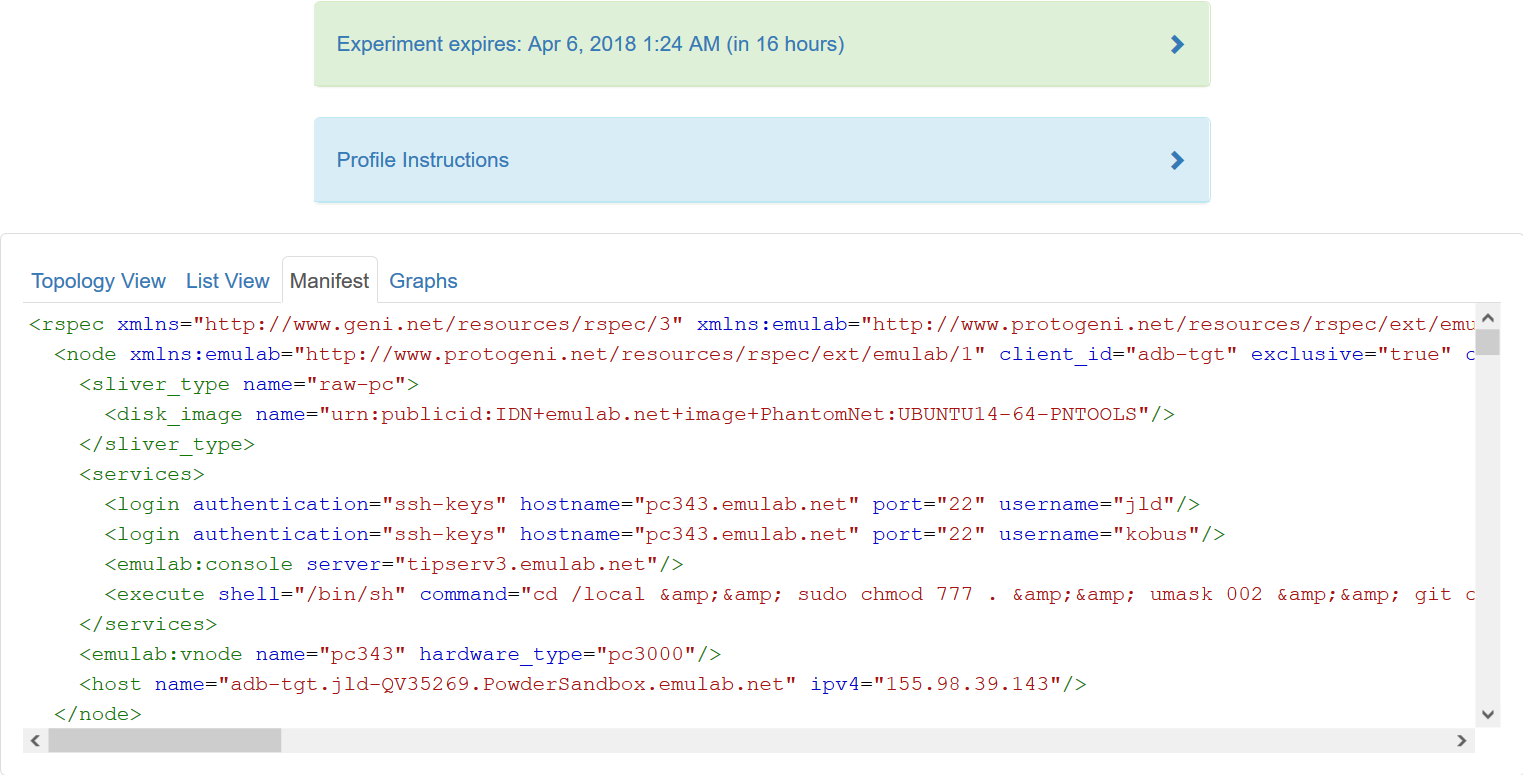
19.5.5 Manifest View
The third default tab shows a manifest detailing the hardware that has been assigned to you. This is the “request” RSpec that is used to define the profile, annotated with details of the hardware that was chosen to instantiate your request. This information is available on the nodes themselves using the geni-get command, enabling you to do rich scripting that is fully aware of both the requested topology and assigned resources.
Most of the information displayed on the Powder status page comes directly from this manifest; it is parsed and laid out in-browser.
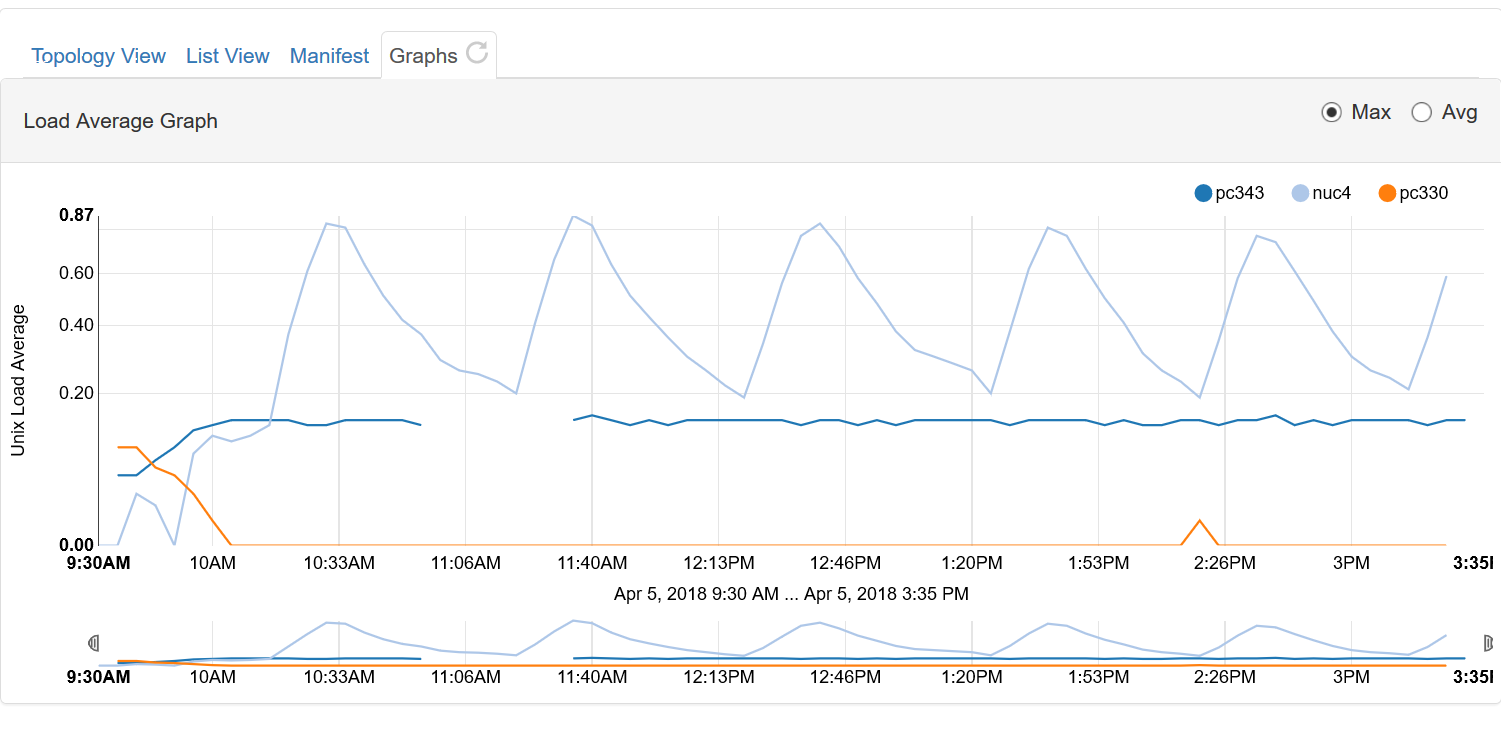
19.5.6 Graphs View
The final default tab shows a page of CPU load and network traffic graphs for the nodes in your experiment. On a freshly-created experiment, it may take several minutes for the first data to appear. After clicking on the “Graphs” tab the first time, a small reload icon will appear on the tab, which you can click to refresh the data and regenerate the graphs. For instance, here is the load average graph for an OAI experiment running this profile for over 6 hours. Scroll past this screenshot to see the control and experiment network traffic graphs. In your experiment, you’ll want to wait 20-30 minutes before expecting to see anything interesting.
19.5.7 Actions
In both the topology and list views, you have access to several actions that you may take on individual nodes. In the topology view, click on the node to access this menu; in the list view, it is accessed through the icon in the “Actions” column. Available actions include rebooting (power cycling) a node, and re-loading it with a fresh copy of its disk image (destroying all data on the node). While nodes are in the process of rebooting or re-imaging, they will turn yellow in the topology view. When they have completed, they will become green again. The shell action is described in more detail below.
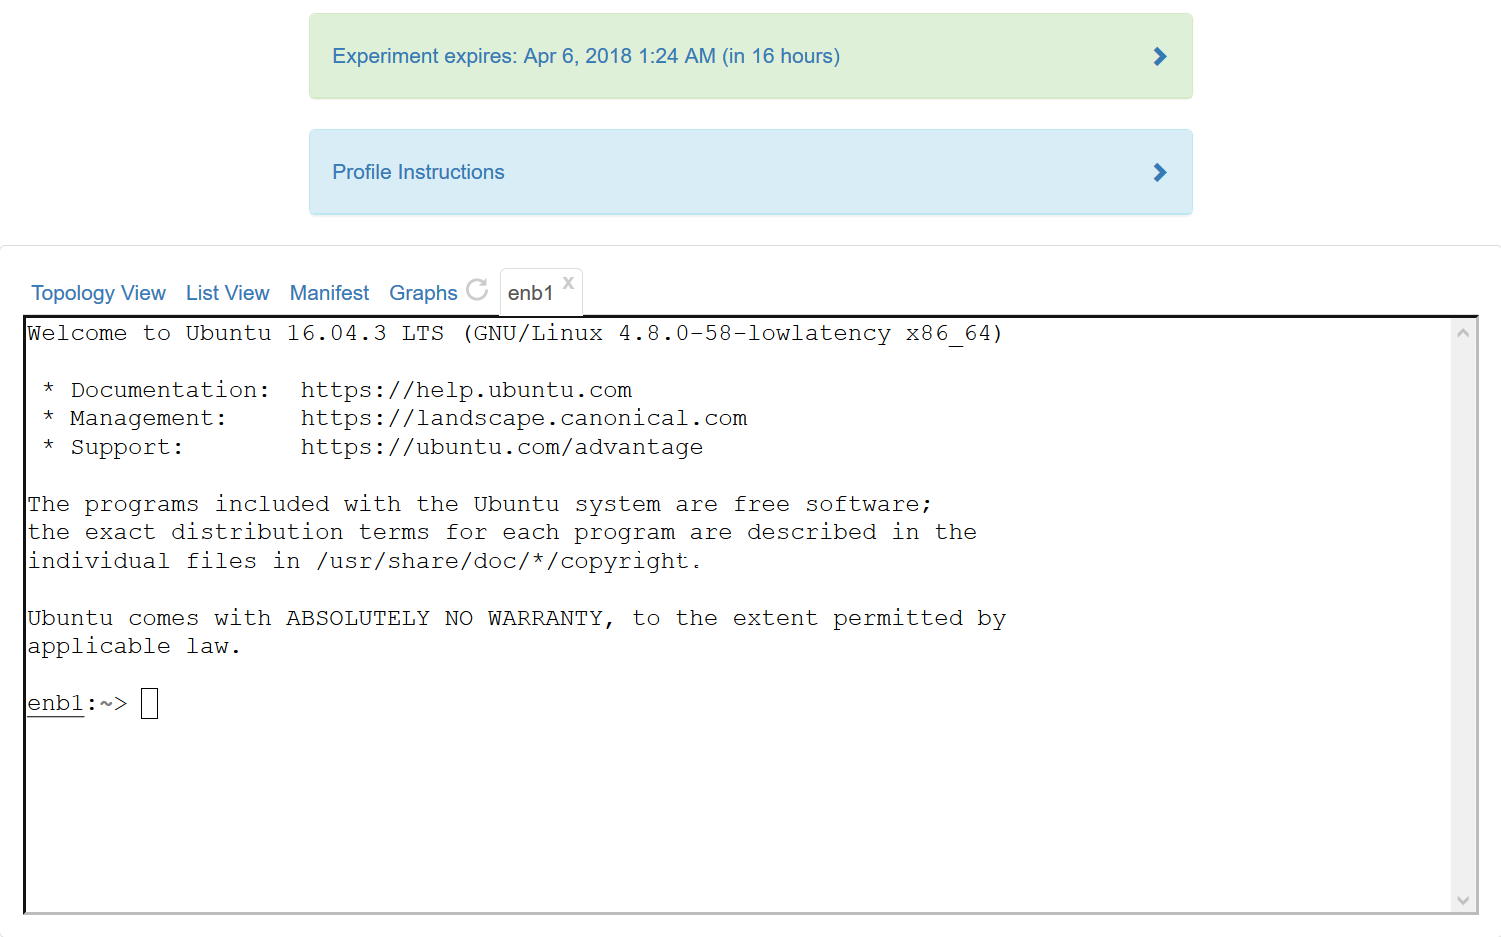
19.5.8 Web-based Shell
Powder provides a browser-based shell for logging into your nodes, which is accessed through the action menu described above. While this shell is functional, it is most suited to light, quick tasks; if you are going to do serious work, on your nodes, we recommend using a standard terminal and ssh program.
This shell can be used even if you did not establish an ssh keypair with your account.
Two things of note:
Your browser may require you to click in the shell window before it gets focus.
Depending on your operating system and browser, cutting and pasting into the window may not work. If keyboard-based pasting does not work, try right-clicking to paste.
19.6 Starting OAI Services
The OAI profile provides a complete LTE networking system. The UE is an off-the-shelf Nexus 5 phone. It uses an Intel NUC with an attached USRP SDRs to implement a RAN and eNodeB. And it uses a compute node to provide an EPC including an MME, HSS, and SPGW.
Let’s start up these four OAI services. First you will want to log into either the “enb1” or “epc” nodes. It is best to log in using a standard terminal, but you can use the web shell as well. Once you are logged in, we have provided a single script that starts up all the services on both nodes in the proper order:
sudo /local/repository/bin/start_oai.pl |
After running this command, any running services will be stopped and a new set of OAI services will start.
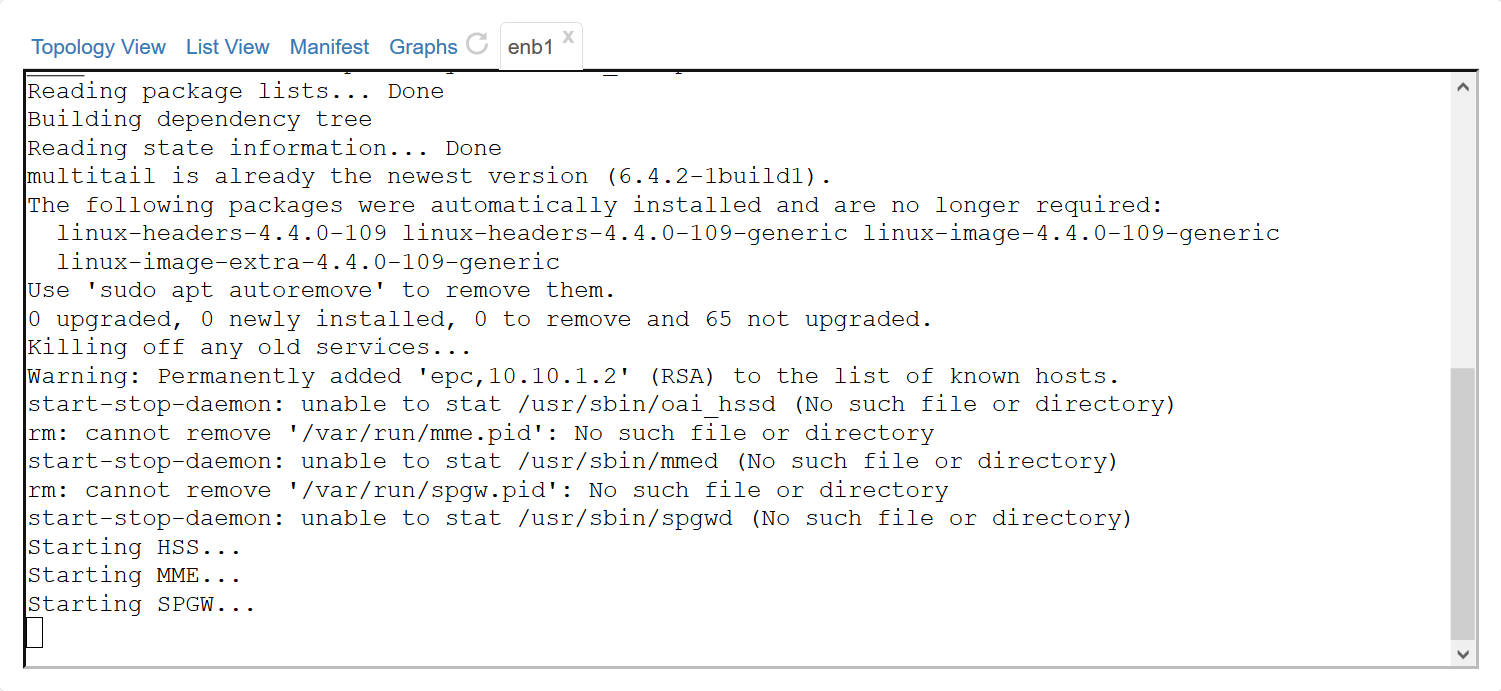
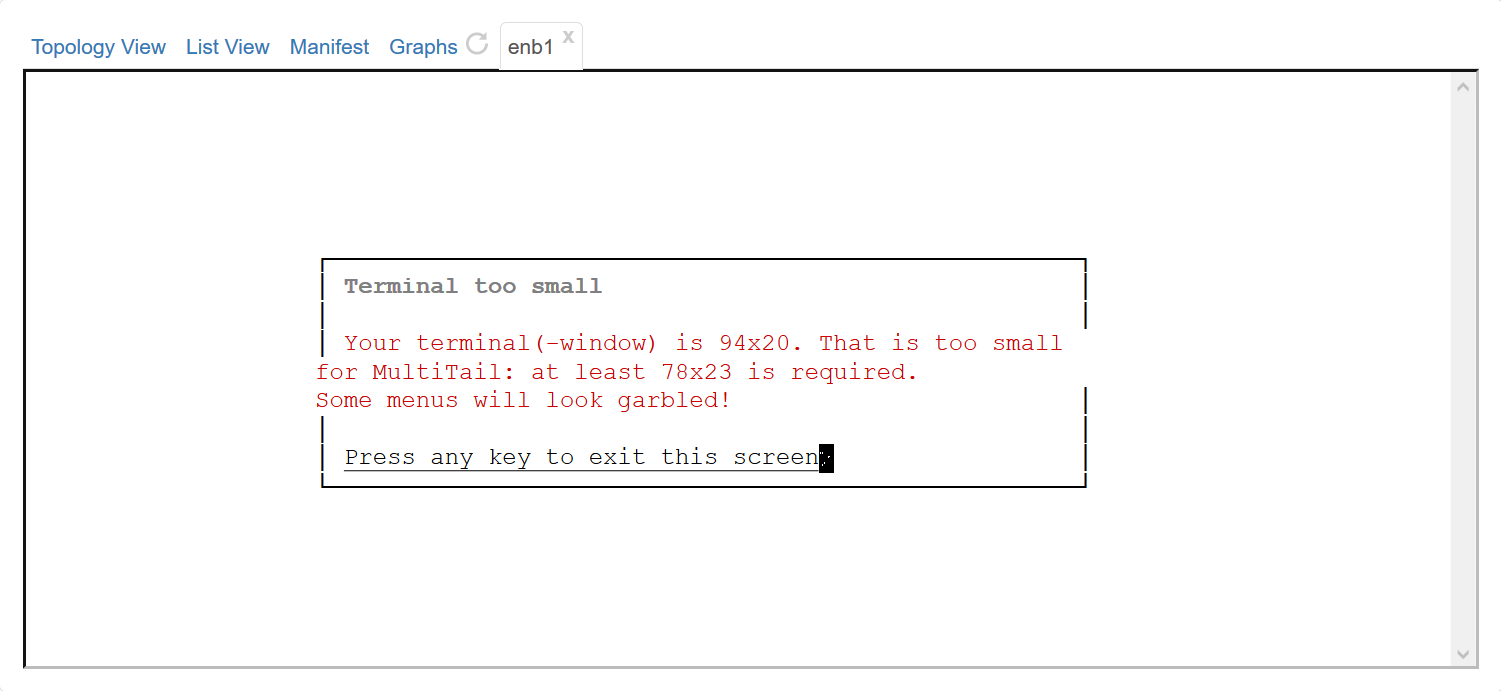
Once all services have begun, it will run multitail so that you can simultaneously see the logfiles of both the MME and eNodeB services. If you are using the web shell, the view of both files will be cramped and you may have to press a key to skip past this warning.
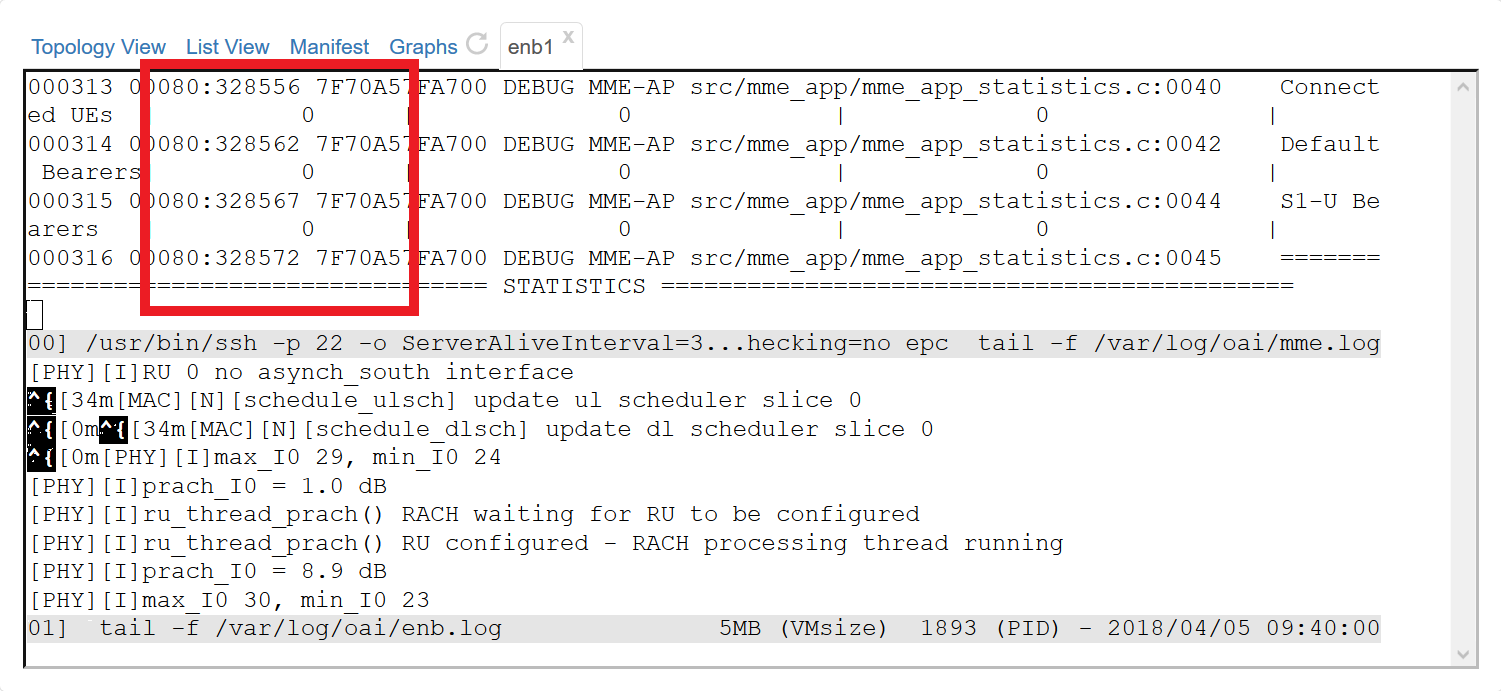
The top half of the multitail output will show all the logs from the MME including periodic status reports about how many eNodeB clients are connected to this MME and whether your UE has connected. You can view the whole log in its own window by logging into the “epc” node and running: “tail -f /var/log/oai/mme.log”
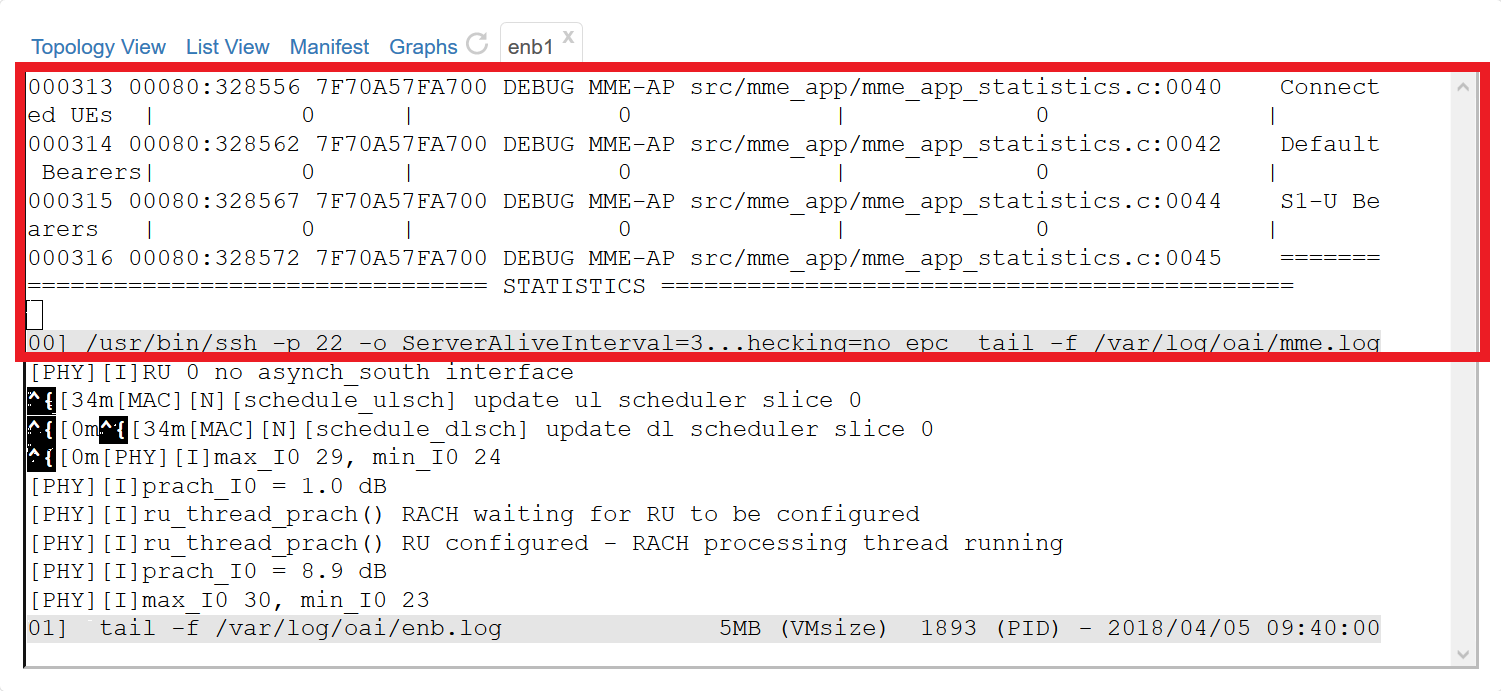
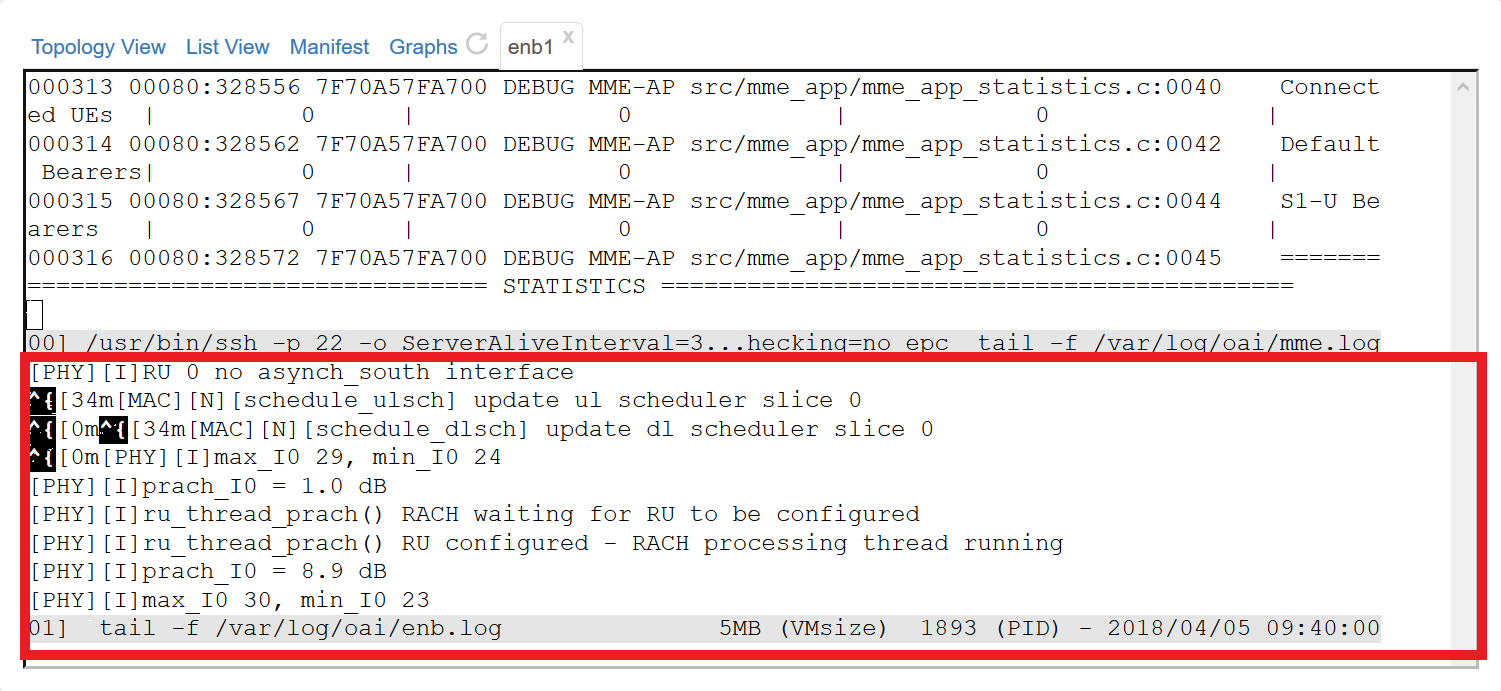
The bottom half of the multitail output shows the logs from the eNodeB. The radio traffic it sees and S1AP messages it sends are logged here. The whole log can be viewed in its own window by logging into the “enb1” node and running: “tail -f /var/log/oai/enb.log”.
19.7 Connecting the UE
Once the OAI services are running, it is time to get the UE to attach. The MME status message that prints periodically indicates how many devices are attached/connected in the far left column. In this screenshot, you can see that the UE has not yet attached because the numbers in the far left column are all ’0’ instead of ’1’.
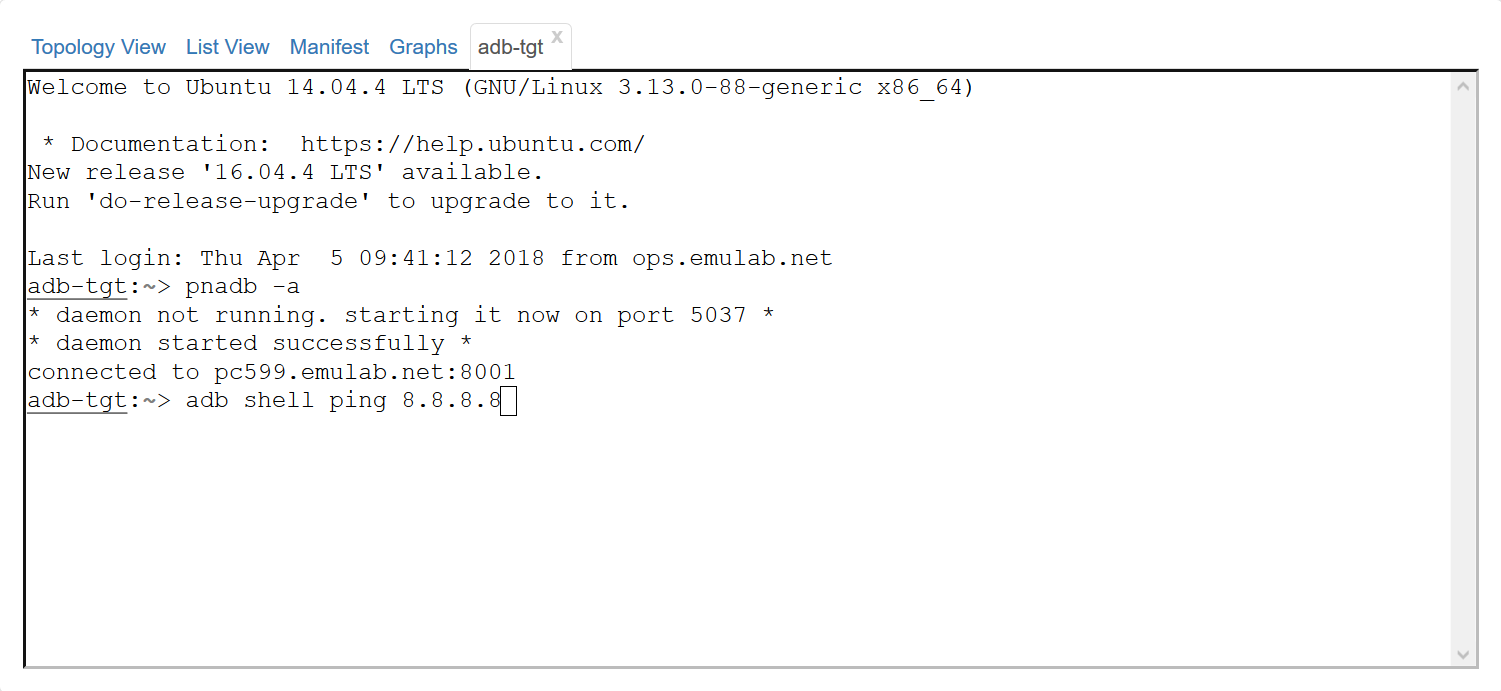
In some cases, if you wait the UE will eventually see the beacon and attach without any other action needed. But if that doesn’t happen on its own, you will want to reboot the UE via “adb”. To control and interact with the UE, we provide an “adb-tgt” node which has a proxied adb connection to the actual UE. Log into that node and run “pnadb -a” to connect the proxy. Once the proxy is connected, you can run commands directly on the node with the “adb shell” command.
If your UE is not attached, you can use “adb reboot” to restart it. If everything else is working, it will usually attach within a minute of rebooting. It is important to realize that rebooting the UE severs the adb connection and it takes a few minutes for the proxy to begin accepting connections again. Just run “pnadb -a” again after a little while and it should re-connect for more “adb” commands.
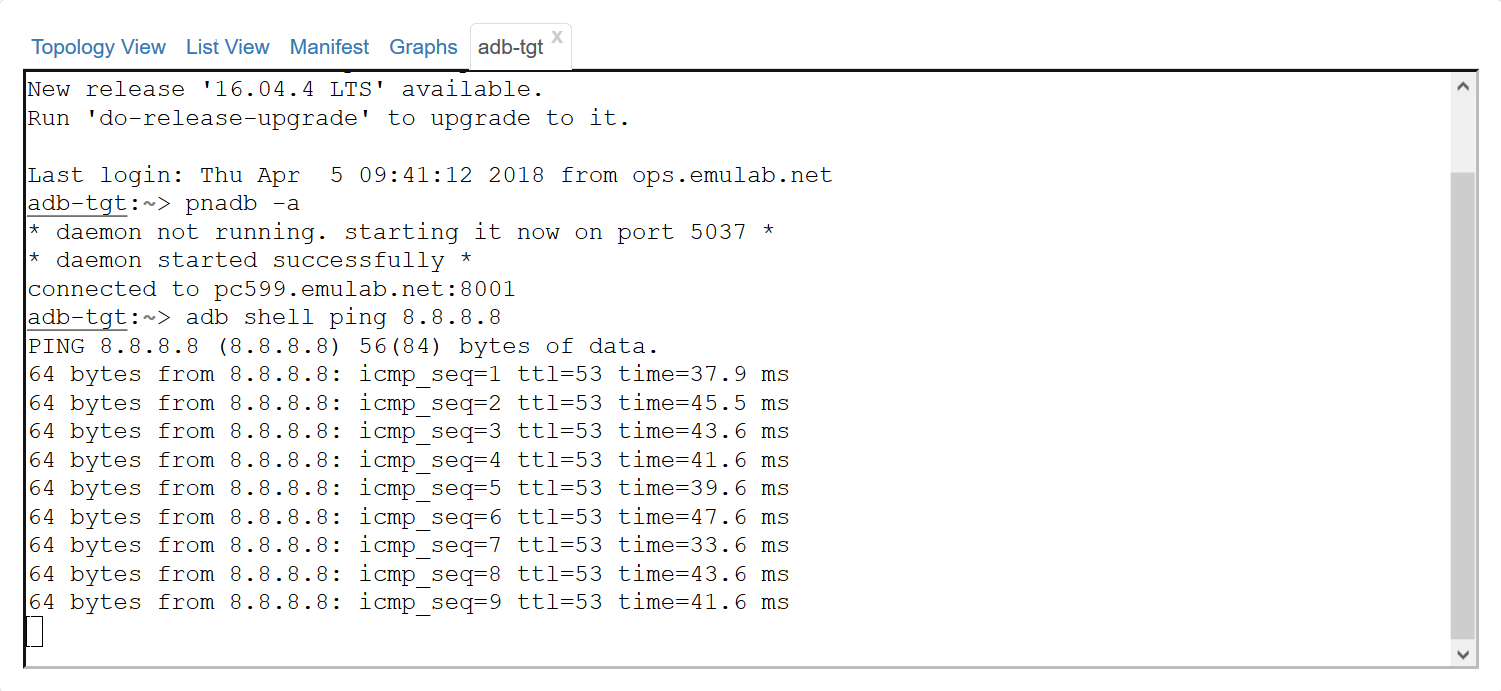
When attached to the OAI EPC, the UE will be able to ping the commodity Internet. Otherwise, it will yield ’network unreachable’.
19.8 In-Depth OAI Profile Documentation
Now you have a complete LTE network running with an actual UE phone and real hardware. You can interact with the UE freely using “adb”, modify the source for OAI and rebuild it, or even create your own version of the profile with your changes. We discuss how to do all of these things in the reference guide for this profile.
OAI Real Hardware Reference Guide
19.9 Terminating the Experiment
Resources that you hold in Powder are real, physical machines and are therefore limited and in high demand. When you are done, you should release them for use by other experimenters. Do this via the “Terminate” button on the Powder experiment status page.
Note: When you terminate an experiment, all data on the nodes is lost, so make sure to copy off any data you may need before terminating.
If you were doing a real experiment, you might need to hold onto the nodes for longer than the default expiration time. You would request more time by using the “Extend” button the on the status page. You would need to provide a written justification for holding onto your resources for a longer period of time.
19.10 Taking Next Steps
Now that you’ve got a feel for for what Powder can do, there are several things you might try next:
Create a new project to continue working on Powder past this tutorial
Try out some profiles other than OAI (use the “Change Profile” button on the “Start Experiment” page)
Read more about the basic concepts in Powder
Try out different hardware
Learn how to make your own profiles